Course Graph
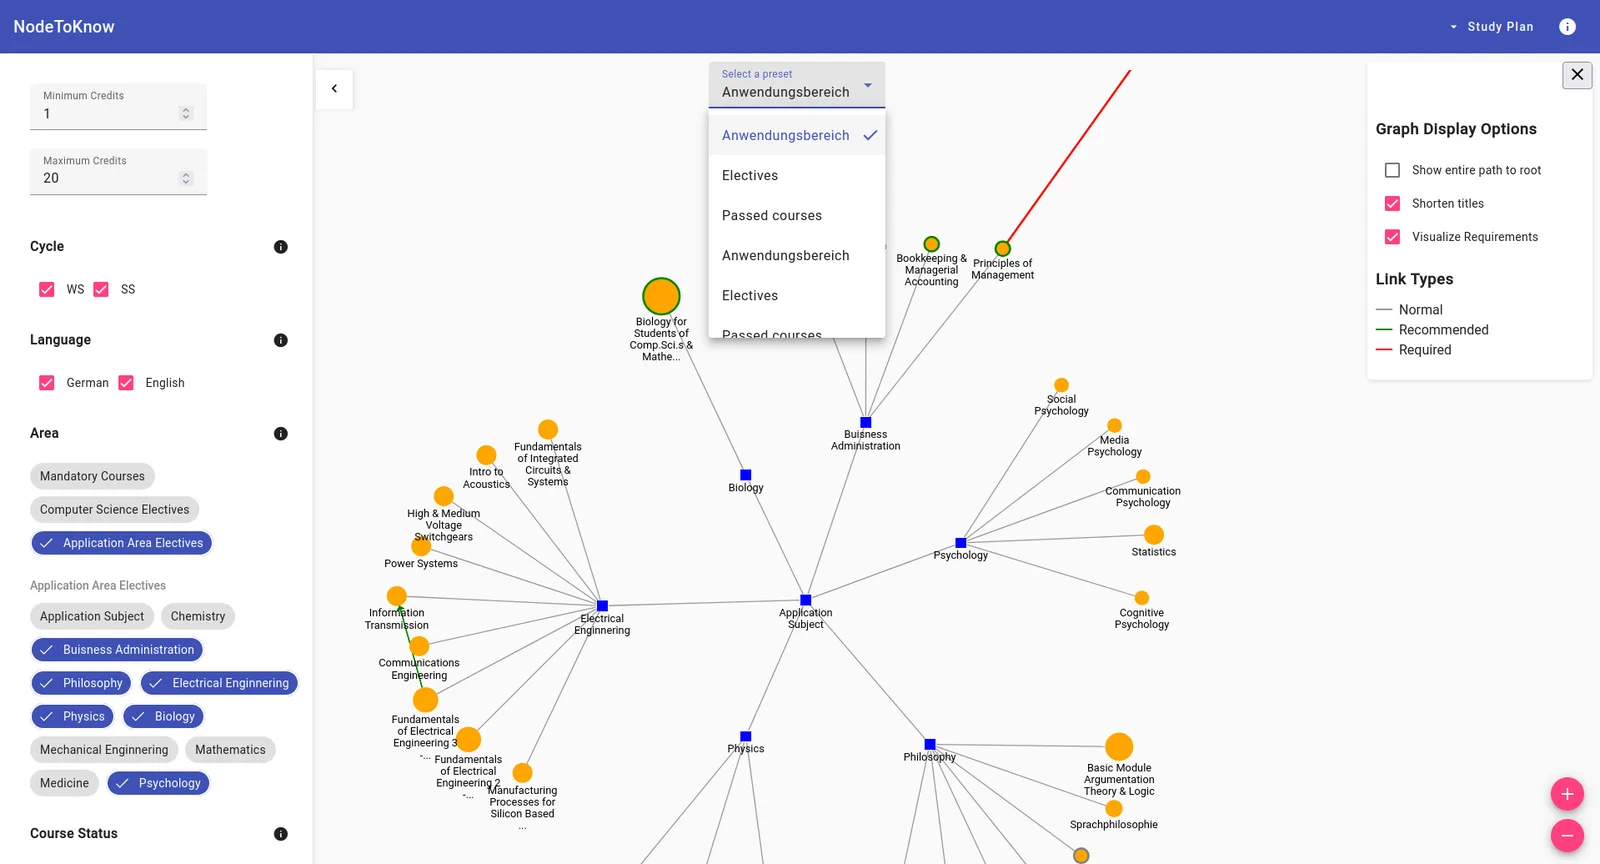
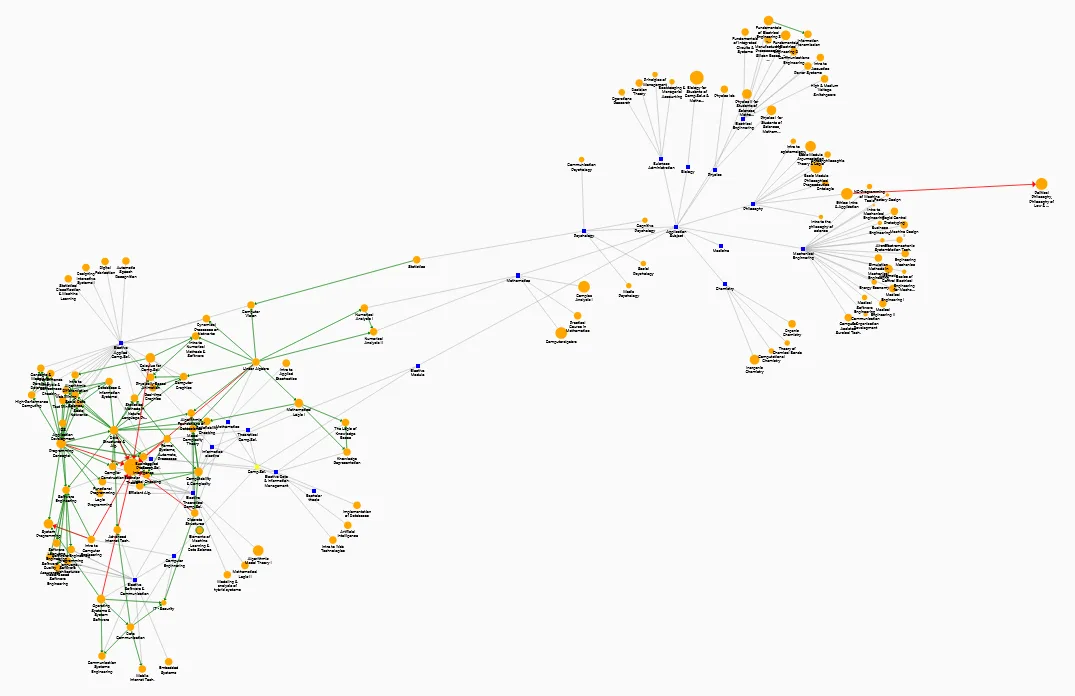
A graph-based visualization of elective courses. It turns the module manual into a prerequisite graph, so students can see at a glance what they can take and what they should take first.
- Role
- Solo project: research, design, implementation, evaluation
- Context
- Bachelor thesis, Computer Science B.Sc., RWTH Aachen
- Methods
- Literature review, stakeholder interviews, think-aloud study, UEQ
- Tools
- Figma, Angular, D3.js
The problem
Open curricula give students freedom, but the information they need is scattered across RWTH Online, the module manual and word of mouth. Students want to know which courses are available, what they cover and what prior knowledge they need. Picking an unsuitable elective can cost grades and time.
My research question: How can a graph-based visualization tool that emphasizes prerequisites support students’ elective course selection in higher education?
Process
I started with a literature review of existing study planning and course visualization tools. I then ran requirement interviews with the stakeholders who know course selection best: the study center, the examination board, program design, the student advisory service and the student council.
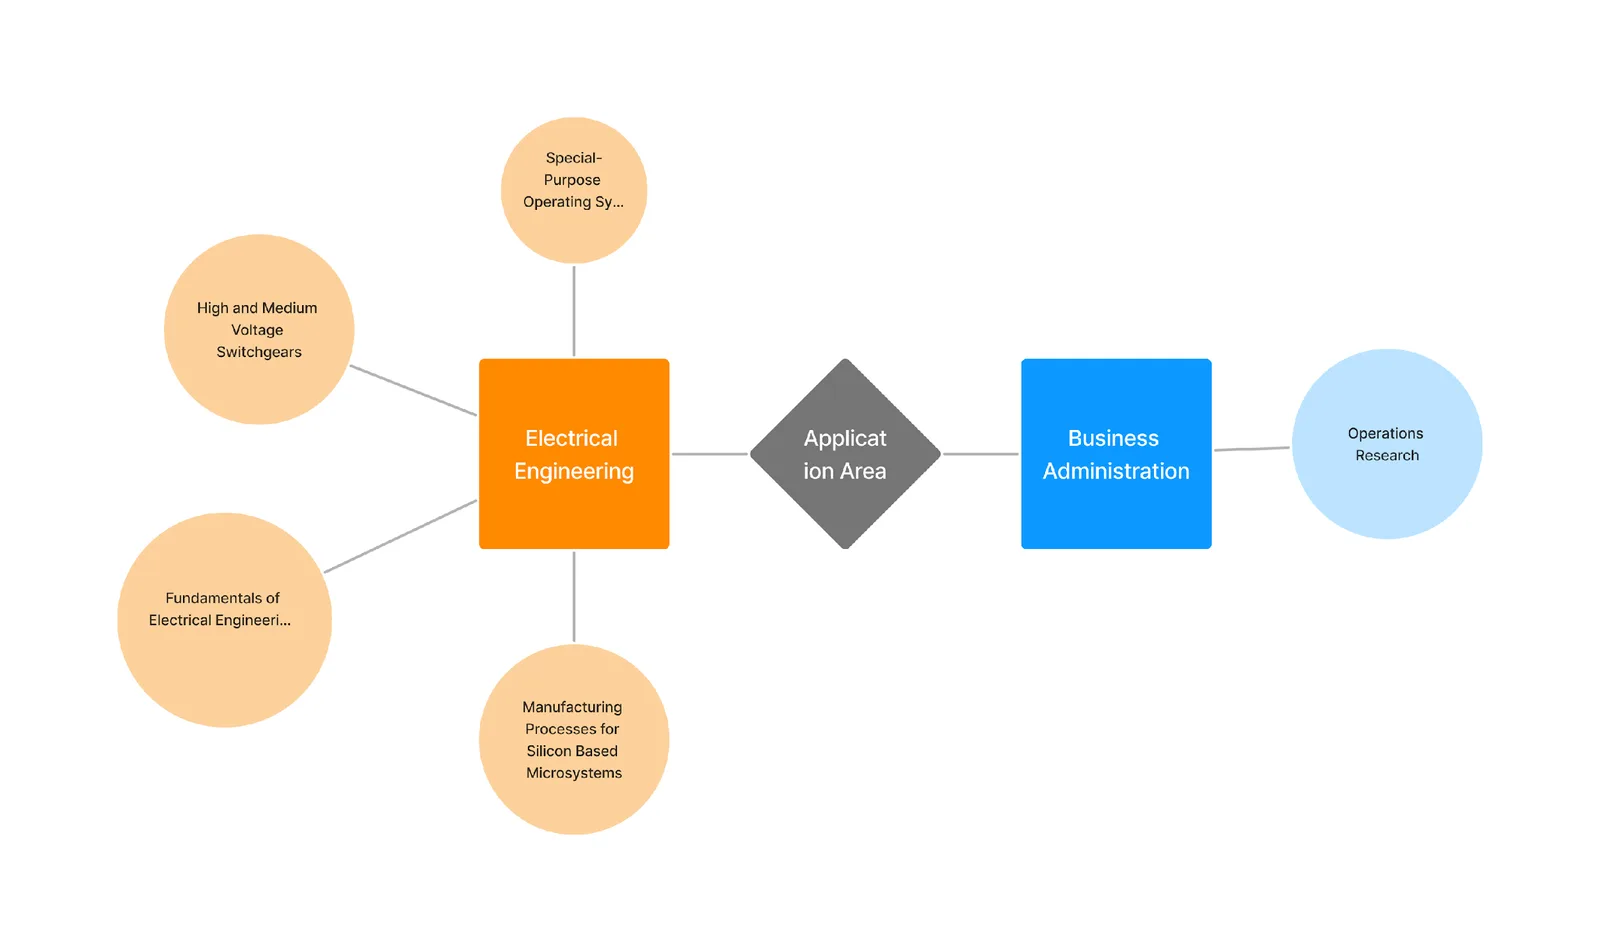
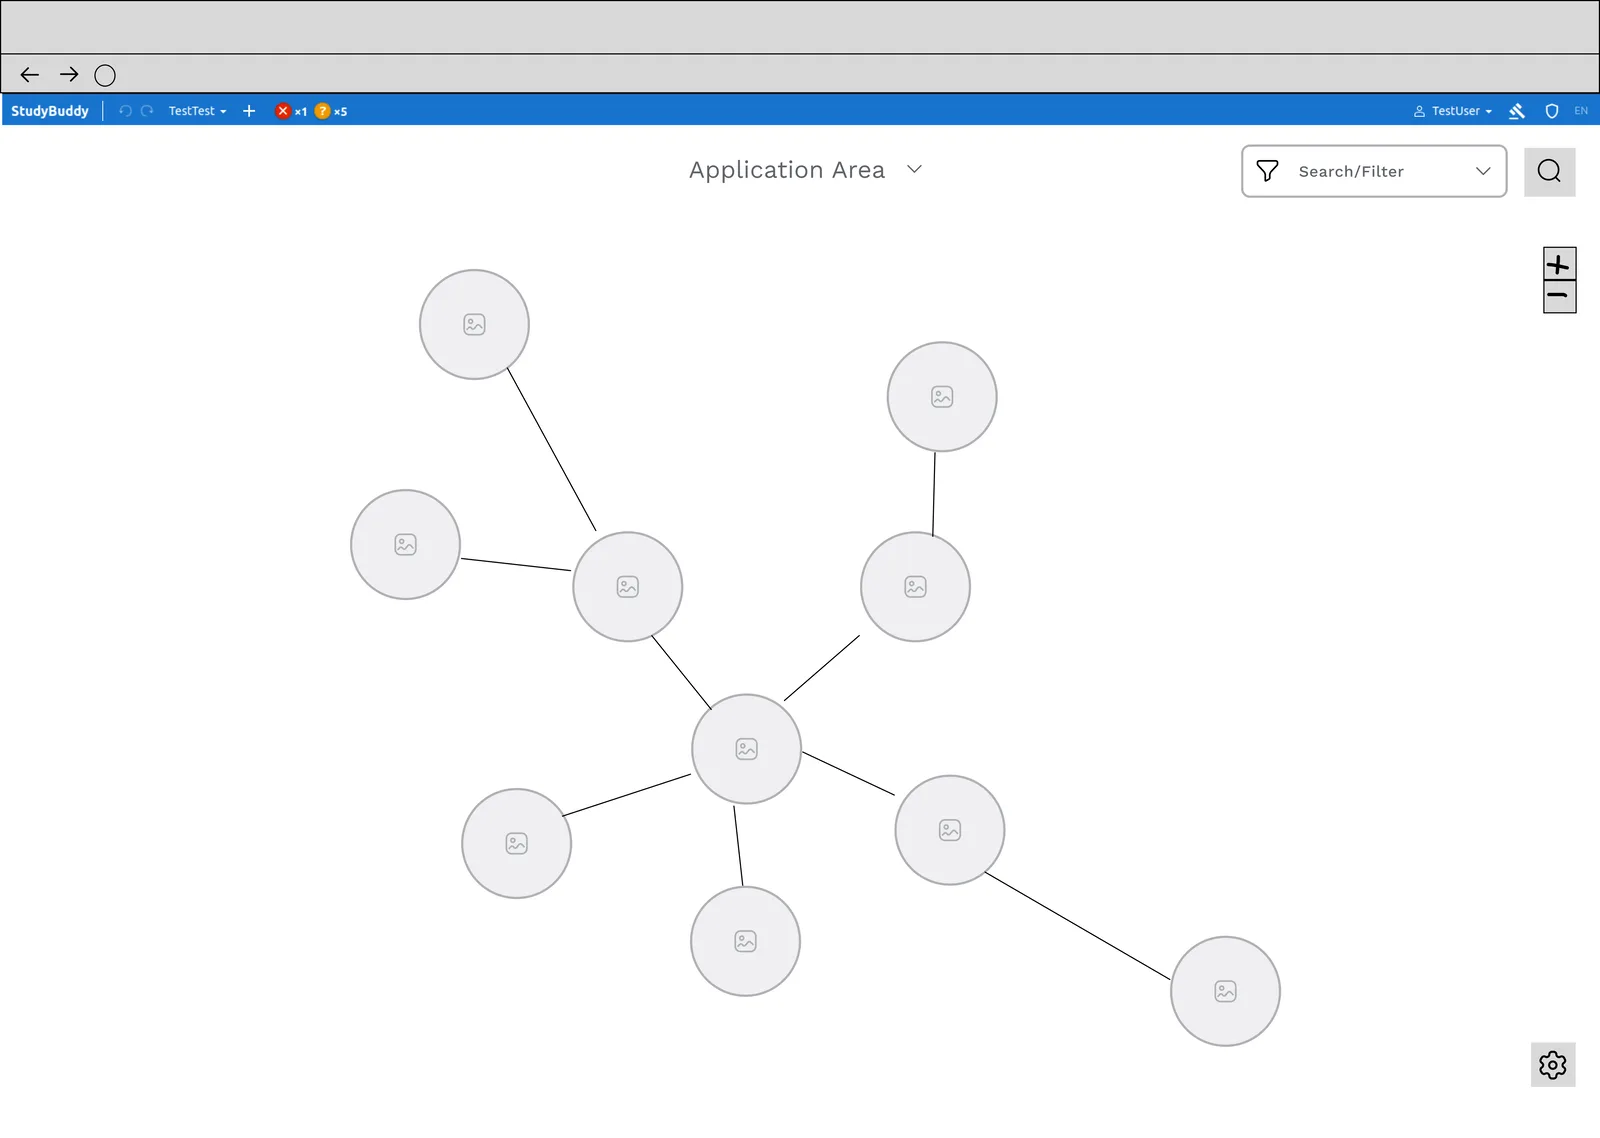
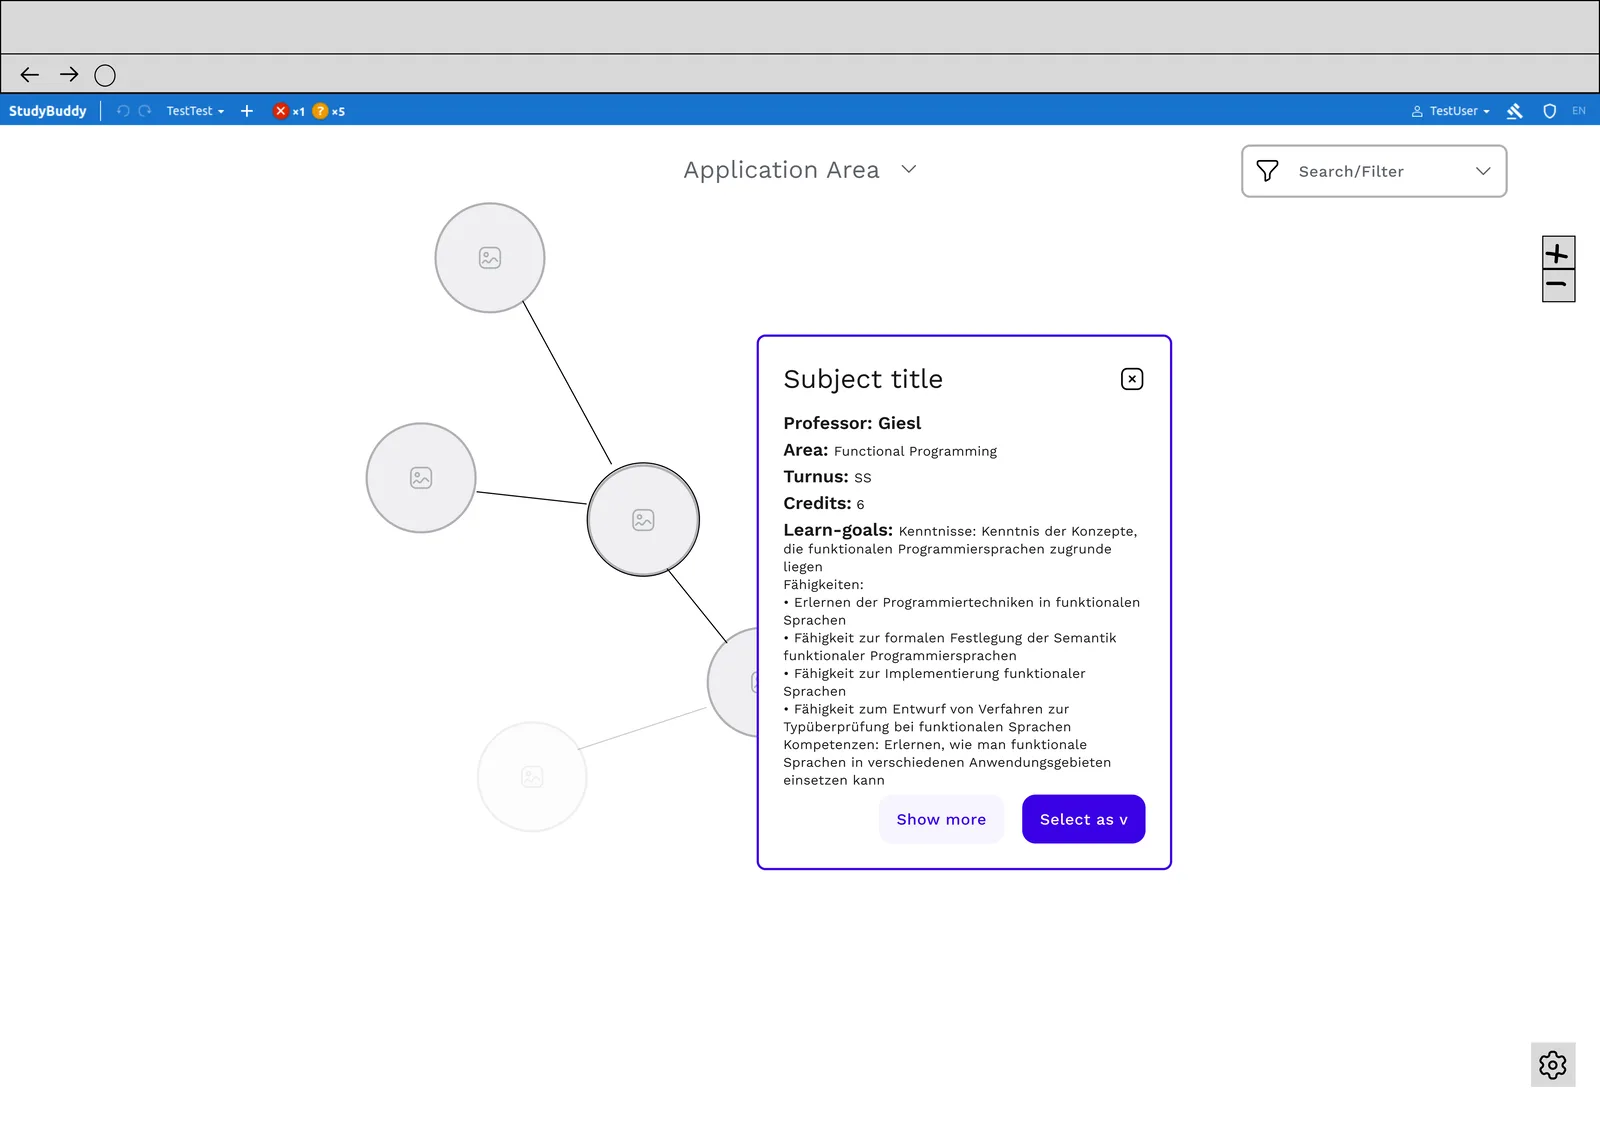
Based on the interviews I explored concepts, designed wireframes in Figma and implemented the tool with Angular and D3.js.
How it works
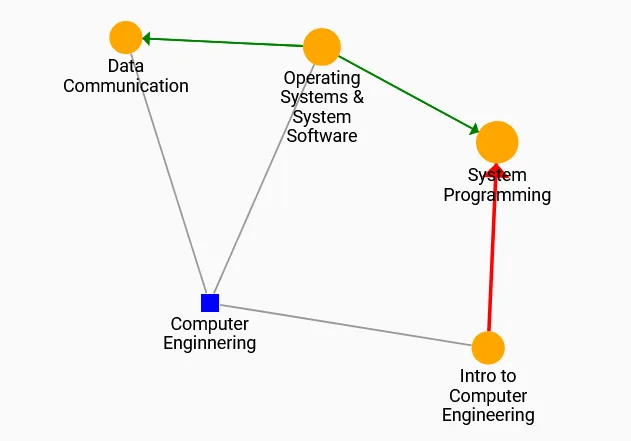
- Prerequisite graph: courses are nodes and prerequisites are edges. Solid edges mean a course must be passed first, dashed edges mean it is only recommended.
- Filters: filter by credits, semester cycle, language and study area. Preset filters, such as CS electives, speed things up, and students can save their own.
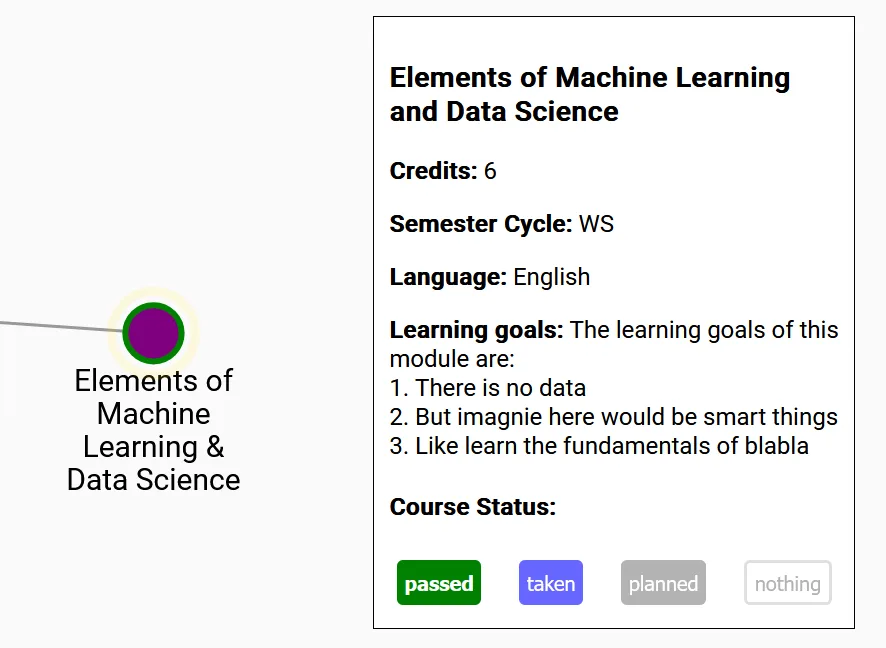
- Course statuses: mark courses as passed, taken or planned, then export and import them to compare different plans.
- Course details: open an info box for each course.
Evaluation
I ran a think-aloud study with 15 RWTH computer science students, using realistic planning scenarios and the User Experience Questionnaire (UEQ). Participants liked the tool and said the graph helped them see their options and plan ahead. Filtering was the favourite feature.
The hedonic qualities scored highest. Perspicuity and efficiency had more room to improve, which matched what I saw in the sessions: the course status was not visible enough and the interface felt complex at first.
UEQ means (n = 15). The scale runs from −3 to +3; values above 0.8 count as positive.
Design changes
I used the feedback for a round of design changes:
- A clearer, more visible course status.
- A dashed line for recommended prerequisites, so they are distinct from required ones.
- Better colour accessibility for people with red-green colour vision deficiency.
Publication
Developing a Graph-based Visualization of Elective Courses to Support Course Selection in Higher Education. 23rd Fachtagung Bildungstechnologien (DELFI 2025), Freiberg.